Transient magnetotellurics refers to the recording of naturally occurring electromagnetic transients in a time localized fashion. This is contrasted with the conventional method where data is acquired continuously for some period of time under the assumption that the source field itself is continuous, i.e., that there are always many thunderstorms in progress on a
global scale.
While the source field is to a good approximation continuous in certain frequency ranges, most notably below 100 Hz, the largest naturally occurring signals in the audio bandwidth are transients and are thus time localized phenomena. These very strong individual events arise from either relatively nearby thunderstorm activity or very large current-moment discharges at greater distance. Due to their large amplitude, the transient signal-to-noise ratio (SNR) is much higher than that associated with the low-level continuing component. Therefore, by triggering off of individual transient events, and recording narrow time windows around each, we obtain the best possible SNR. This is especially effective for higher frequencies above ![]() 300Hz where the transients become increasingly time localized and the continuing component due to global thunderstorm activity diminishes.
300Hz where the transients become increasingly time localized and the continuing component due to global thunderstorm activity diminishes.
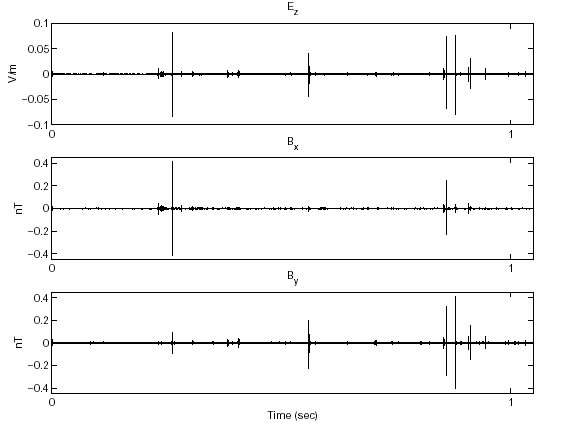
An example is shown in Figure 1 below. Despite the fact that the SNR is quite high around the location of the transients, the SNR of the entire window as a whole is much lower due to the long periods of relative inactivity which occupy most of the window.

Figure 1: Transient and Continuing components, 5-15 kHz B.W.
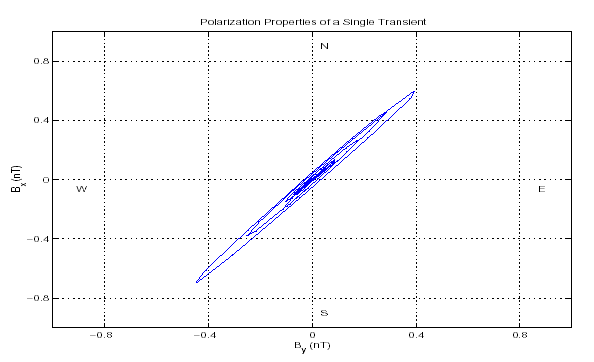
Therefore, by recording only transient energy in a time localized manner we obtain the best possible SNR. However, each transient is strongly linearly polarized. This is shown in Figure 2 where we see the polarization properties of a typical transient. A scatter plot of the horizontal magnetic flux density forms an approximately straight line, therefore, we say that the wave is linearly polarized. Note that the direction of propagation is perpendicular to the direction of field oscillation. Therefore, this event propagated from either the North-West or the South-East, in fact we know that this transient originated in the Gulf of Mexico approximately 3200 km South-East of Saskatoon, Saskatchewan.

Figure 2: Scatter Plot of ![]() for a single transient
for a single transient
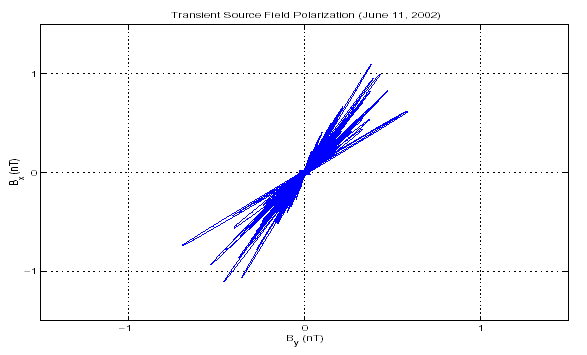
If we instead examine the polarization properties of a group of recorded transients, we typically see something similar to Figure 3. Namely, a tightly clustered distribution of bearings with incoming energy confined to one quadrant only. It is only in times of very high source field activity that we may see a more scattered distribution of bearings.

Figure 3: Scatter Plot of ![]() for a group of transients
for a group of transients
This is very important as the polarization diversity of the recorded data affects the stability of the 2x2 linear system which needs to be solved to estimate earth response curves. The extremal angles in the event grouping shown in Figure 3 is analogous to specifying the amount of coupling between a pair of simultaneous linear equations. A very confined
distribution of bearings results in strong coupling and hence a more unstable system, a wider angle results in less coupling and more stability.
This was the motivation behind the development of our Adaptive Polarization Stacking (APS) algorithm. Namely, we desired an algorithm that produces essentially unbiased parameter and error estimates, but also properly “feels” the polarization diversity of the data, the SNR and the sample size.
This represents an enhancement over conventional Remote-Reference (RR) analysis which assumes that we have a circularly polarized source field with infinite sample size. The assumption of a circularly polarized source field is only approximately realized in times of very high source field activity, most times this is a very poor assumption. In reality then, RR estimates are indeed biased with sometimes quite poorly estimated error bars.
Conversely, our APS algorithm properly incorporates the polarization properties of the source field, the SNR of the data and the sample size to obtain solid parameter and error estimates.
We have shown, given typical polarization characteristics of transient data, that our APS algorithm has a higher order bias convergence than RR. . Even with the confined source field shown in Figure 3, we can reduce the bias to less than one part per million with our APS algorithm.
Please see the publications page for a more detailed theoretical discussion (seg01.pdf). Confirmation of the super-exponential bias convergence of our APS method and a more detailed comparison with RR is contained therein.
Our general brochure can be downloaded here, please Click Here.
